Графики в TIKZ для Latex
Categories:
Дружелюбный функционал для полной графики в Latex. Картинки, иконки, графики и пр. Очень мощный пакет в котором можно нарисовать все.
Установка пакета
\usepackage{tikz}
Использование пакета
Окружение {tikzpicture} или команды \tikzpicture и \endtikzpicture
\documentclass{article} % say
\usepackage{tikz}
\begin{document}
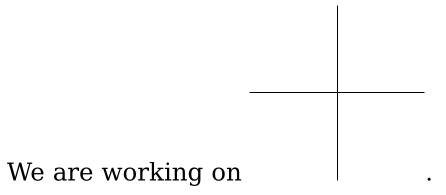
We are working on
\begin{tikzpicture}
\draw (-1.5,0) -- (1.5,0);
\draw (0,-1.5) -- (0,1.5);
\end{tikzpicture}.
\end{document}
Нарисует точки в координатах и проведет через них кривую
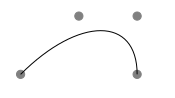
\begin{tikzpicture}
  \filldraw [gray] (0,0) circle [radius=2pt]
                   (1,1) circle [radius=2pt]
                   (2,1) circle [radius=2pt]
                   (2,0) circle [radius=2pt];
  \draw (0,0) .. controls (1,1) and (2,1) .. (2,0);
\end{tikzpicture}
Цвет
filldraw [gray] — зальет фигуру серым цветом
Кривые
.. controls — укажет контрольные точки для кривой Безье.
Окружность
circle [radius=10pt] — нарисует окружность
нарисуем эллипс
\tikz \draw (0,0) ellipse [x radius=20pt, y radius=10pt];
Поворот рисунка
\draw[rotate=30] — развернет рисунок на 30гр.
нарисуем квадраты
 \draw (0,0) rectangle (0.5,0.5);
 \draw (-0.5,-0.5) rectangle (-1,-1);
Нарисуем сетку
\tikz \draw[step=2pt] (0,0) grid (10pt,10pt);
нарисует сетку козявочку 
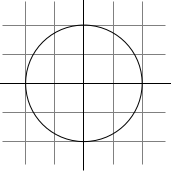
\begin{tikzpicture}
  \draw[step=.5cm,gray,very thin] (-1.4,-1.4) grid (1.4,1.4);
  \draw (-1.5,0) -- (1.5,0);
  \draw (0,-1.5) -- (0,1.5);
  \draw (0,0) circle [radius=1cm];
\end{tikzpicture}
в draw — определим шаг, цвет и толщину линий
Установим настройку стилей по умолчанию
Глобально в переменной Ra grid
\tikzset{Ra grid/.style={help lines,color=blue!50}}
или локально в переменной Karl's grid
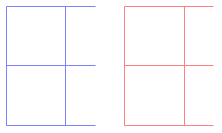
\begin{tikzpicture}
  [Karl's grid/.style ={help lines,color=#1!50},
   Karl's grid/.default=blue]

  \draw[Karl's grid]     (0,0) grid (1.5,2);
  \draw[Karl's grid=red] (2,0) grid (3.5,2);
\end{tikzpicture}
Толщина линий
- ultra thin
- very thin
- thin
- semithick
- thick
- very thick
- ultra thick
 \draw[ultra thin] (-1.5,1.1) -- (1.5,1.1);
\draw[very thin] (-1.5,1.6) -- (1.5,1.6);
\draw[thin] (-1.5,2.1) -- (1.5,2.1);
\draw[semithick] (-1.5,2.6) -- (1.5,2.6);
\draw[very thick] (-1.5,3.1) -- (1.5,3.1);
\draw[ultra thick] (-1.5,3.6) -- (1.5,3.6);

\begin{tikzpicture}[line width=5pt] — любая толщина
Стиль линии
- loosely dashed,
- densely dashed,
- loosely dotted,
- densely dotted
 \draw[loosely dashed, ultra thick] (-1.5,-3.6) -- (1.5,-3.6);
\draw[densely dashed, ultra thick] (-1.5,-3.1) -- (1.5,-3.1);
\draw[loosely dotted, ultra thick] (-1.5,-2.6) -- (1.5,-2.6);
\draw[densely dotted, ultra thick] (-1.5,-2.1) -- (1.5,-2.1);

dash pattern — можно определить сложный паттерн
Нарисуем дугу
arc[start angle=10, end angle=80, radius=10pt]
Элипсоидная дуга
\tikz \draw (0,0)
    arc [start angle=0, end angle=315,
         x radius=1.75cm, y radius=1cm];
Масштабирование
\begin{tikzpicture}[scale=3]
  \draw[step=.5cm,gray,very thin] (-1.4,-1.4) grid (1.4,1.4);
  \draw (-1.5,0) -- (1.5,0);
  \draw (0,-1.5) -- (0,1.5);
  \draw (0,0) circle [radius=1cm];
  \draw (3mm,0mm) arc [start angle=0, end angle=30, radius=3mm];
\end{tikzpicture}
после определения окружения, ставим [scale=3]
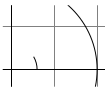
Клиппинг
или обрезание рисунка
\clip (-0.1,-0.2) rectangle (1.1,0.75);
две точки на рисунке для обрезки прямоугольником, обрезать можно любой фигурой
\begin{tikzpicture}[scale=3]
  \clip (-0.1,-0.2) rectangle (1.1,0.75);
  \draw[step=.5cm,gray,very thin] (-1.4,-1.4) grid (1.4,1.4);
  \draw (-1.5,0) -- (1.5,0);
  \draw (0,-1.5) -- (0,1.5);
  \draw (0,0) circle [radius=1cm];
  \draw (3mm,0mm) arc [start angle=0, end angle=30, radius=3mm];
\end{tikzpicture}
Основные команды рисования
\path[draw, clip] или \path[clip] или \path[draw] — братья по смыслу и к ним же \draw[clip]
Параболы, синусы и изгибы
% чертит параболу в квадрате
\tikz \draw (0,0) rectangle (1,1)  (0,0) parabola (1,1);
% чертит параболу и изгиб, по дороге поменяем размерность координат x и y
\tikz \draw[x=1pt,y=1pt] (0,0) parabola bend (4,16) (6,12);
A sine \tikz \draw[x=1ex,y=1ex] (0,0) sin (1.57,1); curve.
Нарисует прямо в тексте кривулину. A sine (-tikz- diagram) curve.
А вот эта штука покажет, что такое sin и cos на самом деле:
\tikz \draw[x=3.57ex,y=1ex] (0,0) sin (4,1) cos (6,-14) sin (8,12)
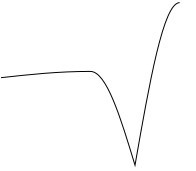
да,именно так — sin поднимаемся, cos — опускаемся
Закрасить пространство
\fill[green!20!white] (0,0) -- (3mm,0mm)
    arc [start angle=0, end angle=30, radius=3mm] -- (0,0);

% или сразу рисуем и красим
\filldraw[fill=green!20!white, draw=green!50!black] (0,0) -- (3mm,0mm)
    arc [start angle=0, end angle=30, radius=3mm] -- cycle;
Замыкание контуров
\begin{tikzpicture}[line width=5pt]
  \draw (0,0) -- (1,0) -- (1,1) -- (0,0);
  \draw (2,0) -- (3,0) -- (3,1) -- cycle;
  \useasboundingbox (0,1.5); % make bounding box higher
\end{tikzpicture}
cycle — плавно замкнет контур, похожа на последнюю команду -- (0,0) но работает лучше
Градиент
Команды shade и shadedraw
\begin{tikzpicture}[rounded corners,ultra thick]
  \shade[top color=yellow,bottom color=black] (0,0) rectangle +(2,1);
  \shade[left color=yellow,right color=black] (3,0) rectangle +(2,1);
  \shadedraw[inner color=yellow,outer color=black,draw=yellow] (6,0) rectangle +(2,1);
  \shade[ball color=green] (9,.5) circle (.5cm);
\end{tikzpicture}

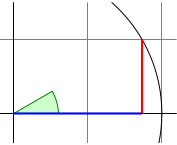
Координаты точек
(x,y) — с указанием размерности или по умолчанию в см.
(30:1cm) — полярные координаты 30 градусов и 1 см.
Относительные перемещения
+(x,y) — переместиться относительно последней точки на x и y
++(x,y) — переместить указатель, но ничего не чертить, чертит только команда --.
\begin{tikzpicture}[scale=3]
  \clip (-0.1,-0.2) rectangle (1.1,0.75);
  \draw[step=.5cm,gray,very thin] (-1.4,-1.4) grid (1.4,1.4);
  \draw (-1.5,0) -- (1.5,0);
  \draw (0,-1.5) -- (0,1.5);
  \draw (0,0) circle [radius=1cm];
  \filldraw[fill=green!20,draw=green!50!black] (0,0) -- (3mm,0mm)
      arc [start angle=0, end angle=30, radius=3mm] -- cycle;
  \draw[red,very thick]  (30:1cm) -- +(0,-0.5);
  \draw[blue,very thick] (30:1cm) ++(0,-0.5) -- (0,0);
\end{tikzpicture}
Определяем свои команды
\begin{tikzpicture}
  \def\rectanglepath{-- ++(1cm,0cm)  -- ++(0cm,1cm)  -- ++(-1cm,0cm) -- cycle}
  \draw (0,0) \rectanglepath;
  \draw (1.5,0) \rectanglepath;
\end{tikzpicture}
нарисует два квадратика
или идентично:
\tikz \draw (0,0) rectangle +(1,1) (1.5,0) rectangle +(1,1);
1,{tan(30)}) — так тоже умеет. Любую функцию для расчета координат.
Координаты по пересекающимся линиям
\path [name path=upward line] (1,0) -- (1,1);
\path [name path=sloped line] (0,0) -- (30:1.5cm);
% Рисуем невидимые пути. \path без атрибутов, просто перемещает указатель
% (добавить библиотеку `\usetikzlibrary{intersections}' после загрузки tikz)
\draw [name intersections={of=upward line and sloped line, by=x}] % нашли точку пересечения и назвали ее x
  [very thick,orange] (1,0) -- (x); % нарисовали линию от (1,0) до точки пересечения
Стрелки
\draw[->] (-1.5,0) -- (1.5,0);
\draw[->] (0,-1.5) -- (0,1.5);
->, <-, <->, <<-, ->>
или использовать специальную библиотеку Documentation arrow
\usetikzlibrary {arrows.meta}
\begin{tikzpicture}[>=Stealth]
Облать видимости
\begin{tikzpicture}[ultra thick]
  \draw (0,0) -- (0,1);
  \begin{scope}[thin]
    \draw (1,0) -- (1,1);
    \draw (2,0) -- (2,1);
  \end{scope}
  \draw (3,0) -- (3,1);
\end{tikzpicture}
Окружение {scope}
Преобразования
xshift=2pt — смещает все точки на 2pt по x
\begin{tikzpicture}[even odd rule,rounded corners=2pt,x=10pt,y=10pt]
  \filldraw[fill=yellow!80!black] (0,0)   rectangle (1,1)
        [xshift=5pt,yshift=5pt]   (0,0)   rectangle (1,1)
                    [rotate=30]   (-1,-1) rectangle (2,2);
\end{tikzpicture}
Самое интересное во всем этом процессе, что когда ты пишешь эти строки и видишь, как все это происходит по настоящему в твоем Latex документе — приходишь в восторг!
xshift и yshift смещают по осям, shift={(1,0)} смещает в точку shift={+(0,0)} или относительную точку.
rotate или rotate around вращают объект относительно точки
scale, xscale, yscale — масштабирует xscale=-1 схлопывает фигуру
xslant, yslant — наклоняет
cm — опция для произвольных преобразований по матрице
Повторения и циклы
Можно использовать независимый пакет для \foreach или он автоматически подключен в Tikz
Синтаксис команды:
\foreach ⟨variable⟩ in {⟨list of values⟩} ⟨commands⟩
Пример:
\foreach \x in {1,2,3} {$x =\x$, }

x=1, x=2, x=3,
\begin{tikzpicture}[scale=3]
  \clip (-0.1,-0.2) rectangle (1.1,1.51);
  \draw[step=.5cm,gray,very thin] (-1.4,-1.4) grid (1.4,1.4);
  \filldraw[fill=green!20,draw=green!50!black] (0,0) -- (3mm,0mm)
      arc [start angle=0, end angle=30, radius=3mm] -- cycle;
  \draw[->] (-1.5,0) -- (1.5,0);
  \draw[->] (0,-1.5) -- (0,1.5);
  \draw (0,0) circle [radius=1cm];

  \foreach \x in {-1cm,-0.5cm,0.5cm,1cm}
    \draw [red](\x,-1pt) -- (\x,1pt);
  \foreach \y in {-1cm,-0.5cm,0.5cm,1cm}
    \draw [blue](-1pt,\y) -- (1pt,\y);
\end{tikzpicture}
Поставил меточки на осях координат
\tikz \foreach \x in {1,...,10}
        \draw (\x,0) circle (0.4cm);
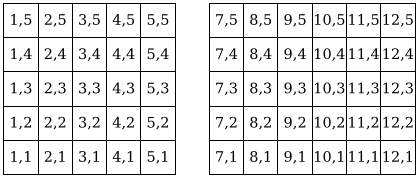
еще вариант для диапазона значений: цикл в цикле
\begin{tikzpicture}
  \foreach \x in {1,2,...,5,7,8,...,12}
    \foreach \y in {1,...,5}
    {
      \draw (\x,\y) +(-.5,-.5) rectangle ++(.5,.5);
      \draw (\x,\y) node{\x,\y};
    }
\end{tikzpicture}
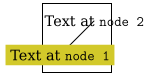
Nodes
\begin{tikzpicture}
  \draw (0,0) rectangle (2,2);
  \draw (0.5,0.5) node [fill=yellow!80!black]
                       {Text at \texttt{node 1}}
     -- (1.5,1.5) node {Text at \texttt{node 2}};
\end{tikzpicture}
любой текст или все что нам нужно можно вставить в Node и поместить в нужную точку координат рисунка
Фон можно закрасить [fill=white]
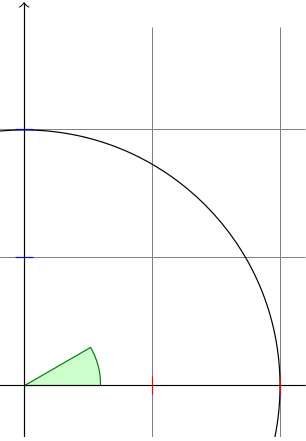
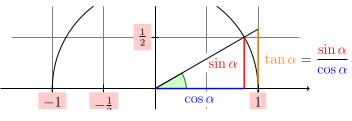
Якоря по сторонам света
На всех рисунках есть якоря со сторонами света:
- north
- south
- east
- west
и их комбинации anchor=south west и т.д.
above rigth тоже, что south west
below=1pt — можно задавать смещение
\usetikzlibrary {intersections}
\begin{tikzpicture}[scale=3]
  \clip (-2,-0.2) rectangle (2,0.8);
  \draw[step=.5cm,gray,very thin] (-1.4,-1.4) grid (1.4,1.4);
  \filldraw[fill=green!20,draw=green!50!black] (0,0) -- (3mm,0mm)
    arc [start angle=0, end angle=30, radius=3mm] -- cycle;
  \draw[->] (-1.5,0) -- (1.5,0) coordinate (x axis);
  \draw[->] (0,-1.5) -- (0,1.5) coordinate (y axis);
  \draw (0,0) circle [radius=1cm];

  \draw[very thick,red]
    (30:1cm) -- node[left=1pt,fill=white] {$\sin \alpha$} (30:1cm |- x axis);
  \draw[very thick,blue]
    (30:1cm |- x axis) -- node[below=2pt,fill=white] {$\cos \alpha$} (0,0);
  \path [name path=upward line] (1,0) -- (1,1);
  \path [name path=sloped line] (0,0) -- (30:1.5cm);
  \draw [name intersections={of=upward line and sloped line, by=t}]
    [very thick,orange] (1,0) -- node [right=1pt,fill=white]
    {$\displaystyle \tan \alpha \color{black}=
      \frac{{\color{red}\sin \alpha}}{\color{blue}\cos \alpha}$} (t);

  \draw (0,0) -- (t);

  \foreach \x/\xtext in {-1, -0.5/-\frac{1}{2}, 1}
    \draw (\x cm,1pt) -- (\x cm,-1pt) node[anchor=north,fill=red!20] {$\xtext$};
  \foreach \y/\ytext in {-1, -0.5/-\frac{1}{2}, 0.5/\frac{1}{2}, 1}
    \draw (1pt,\y cm) -- (-1pt,\y cm) node[anchor=east,fill=red!20] {$\ytext$};
\end{tikzpicture}
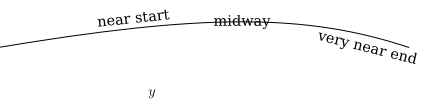
Текст по контуру
\begin{tikzpicture}
  \draw (0,0) .. controls (6,1) and (9,1) ..
    node[near start,sloped,above] {near start}
    node {midway}
    node[very near end,sloped,below] {very near end} (12,0);
\end{tikzpicture}
Полностью пример
\begin{tikzpicture}
  [scale=3,line cap=round,
  % Styles
  axes/.style=,
  important line/.style={very thick},
  information text/.style={rounded corners,fill=red!10,inner sep=1ex}]

  % Colors
  \colorlet{anglecolor}{green!50!black}
  \colorlet{sincolor}{red}
  \colorlet{tancolor}{orange!80!black}
  \colorlet{coscolor}{blue}

  % The graphic
  \draw[help lines,step=0.5cm] (-1.4,-1.4) grid (1.4,1.4);

  \draw (0,0) circle [radius=1cm];

  \begin{scope}[axes]
    \draw[->] (-1.5,0) -- (1.5,0) node[right] {$x$} coordinate(x axis);
    \draw[->] (0,-1.5) -- (0,1.5) node[above] {$y$} coordinate(y axis);

    \foreach \x/\xtext in {-1, -.5/-\frac{1}{2}, 1}
      \draw[xshift=\x cm] (0pt,1pt) -- (0pt,-1pt) node[below,fill=white] {$\xtext$};

    \foreach \y/\ytext in {-1, -.5/-\frac{1}{2}, .5/\frac{1}{2}, 1}
      \draw[yshift=\y cm] (1pt,0pt) -- (-1pt,0pt) node[left,fill=white] {$\ytext$};
  \end{scope}

  \filldraw[fill=green!20,draw=anglecolor] (0,0) -- (3mm,0pt)
    arc [start angle=0, end angle=30, radius=3mm];
  \draw (15:2mm) node[anglecolor] {$\alpha$};

  \draw[important line,sincolor]
    (30:1cm) -- node[left=1pt,fill=white] {$\sin \alpha$} (30:1cm |- x axis);

  \draw[important line,coscolor]
    (30:1cm |- x axis) -- node[below=2pt,fill=white] {$\cos \alpha$} (0,0);

  \path [name path=upward line] (1,0) -- (1,1);
  \path [name path=sloped line] (0,0) -- (30:1.5cm);
  \draw [name intersections={of=upward line and sloped line, by=t}]
    [very thick,orange] (1,0) -- node [right=1pt,fill=white]
    {$\displaystyle \tan \alpha \color{black}=
      \frac{{\color{red}\sin \alpha}}{\color{blue}\cos \alpha}$} (t);

  \draw (0,0) -- (t);

  \draw[xshift=1.85cm]
    node[right,text width=6cm,information text]
    {
      The {\color{anglecolor} angle $\alpha$} is $30^\circ$ in the
      example ($\pi/6$ in radians). The {\color{sincolor}sine of
        $\alpha$}, which is the height of the red line, is
      \[
      {\color{sincolor} \sin \alpha} = 1/2.
      \]
      By the Theorem of Pythagoras ...
    };
\end{tikzpicture}
Для node задали ширину текста text width=6cm
Макросы
\usetikzlibrary {angles,quotes}
\begin{tikzpicture}[scale=3]
  \coordinate (A) at (1,0);
  \coordinate (B) at (0,0);
  \coordinate (C) at (30:1cm);

  \draw (A) -- (B) -- (C)
        pic [draw=green!50!black, fill=green!20, angle radius=9mm,
             "$\alpha$"] {angle = A--B--C};
\end{tikzpicture}
Команда pic создает макрос для последующего использования кода.