Диаграммы в Latex библиотека TIKZ
Categories:
Возможности библиотеки TIKZ для рисования графиков в Latex. Обзор учебника из документации.
Библиотеки для работы с диаграммами
\usetikzlibrary {
positioning,% нативные позиции node
shapes.misc, % настройка внешнего вида фигур, углы и т.д.
graphs, % работает с диаграммами и графами
calc, % считает координаты
arrows.meta % рисует наконечники стрел
}
Стилизация узлов диаграммы
Простой прямоугольник (Не-Терминал)
\usetikzlibrary {positioning}
\begin{tikzpicture}[
    nonterminal/.style={
      % The shape:
      rectangle,
      % The size:
      minimum size=6mm,
      % The border:
      very thick,
      draw=red!50!black!50,         % 50% red and 50% black,
                                    % and that mixed with 50% white
      % The filling:
      top color=white,              % a shading that is white at the top...
      bottom color=red!50!black!20, % and something else at the bottom
      % Font
      font=\itshape
    }]
  \node [nonterminal] {unsigned integer};
\end{tikzpicture}
В стиле определил:
- rectangle
- minimum size
- border — красночерного цвета толстый бордюр
- filling — градиент top и bottom
- font
Для рисования просто пишу NODE и все готово 
Стиль терминалов с круглыми углами
\usetikzlibrary {positioning}
\begin{tikzpicture}[node distance=5mm,
                    terminal/.style={
                      % The shape:
                      rectangle,minimum size=6mm,rounded corners=3mm,
                      % The rest
                      very thick,draw=black!50,
                      top color=white,bottom color=black!20,
                      font=\ttfamily}]
  \node (dot)   [terminal]                {.};
  \node (digit) [terminal,right=of dot]   {digit};
  \node (E)     [terminal,right=of digit] {E};
\end{tikzpicture}
Как приятно писать что-то, когда ты понимаешь, что ты это понимаешь)))
В стиле определено:
- node distance — это значит,что расстояние между
nodeбудет, то, которое задано. - terminal — название стиля
- rectangle — форма
- minimum size
- rounded corners — радиус закругления углов (закругляет у любой фигуры \node, \fill, \path)
- very thick — толщина обводки
- top, bottom — градиент заливки
- font
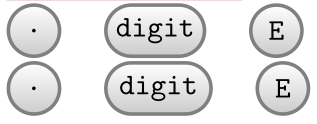
Односимвольный терминал станет кругом, а многосимвольный — прямоугольником с закругленными углами.
Использование библиотеки shapes.misc
Только немного изменится настройка в описании стиля
[node distance=5mm,
                    terminal/.style={
                      % The shape:
                      rounded rectangle,
                      minimum size=6mm,
                      % The rest
                      very thick,draw=black!50,
                      top color=white,bottom color=black!20,
                      font=\ttfamily}]
убрали rounded corners а поставили rounded rectangle — собственно и все. Но разметка слегка отъехала. На рисунке можно увидеть небольшую разницу.
Выравнивание текста в терминалах
Просто добавляем в стиль высоту и глубину строки [text height=1.5ex,text depth=.25ex]
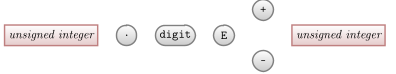
Полезная библиотека позиционирования
\usetikzlibrary {positioning,shapes.misc}
\begin{tikzpicture}[node distance=5mm and 5mm]
  \node (ui1)   [nonterminal]                     {unsigned integer};
  \node (dot)   [terminal,right=of ui1]           {.};
  \node (digit) [terminal,right=of dot]           {digit};
  \node (E)     [terminal,right=of digit]         {E};
  \node (plus)  [terminal,above right=of E]       {+};
  \node (minus) [terminal,below right=of E]       {-};
  \node (ui2)   [nonterminal,below right=of plus] {unsigned integer};
\end{tikzpicture}
основные команды:
- right=of
- left=of
- above=of
- below=of
- above right=of
- и т.д.
Перенесем настройки стилей в преамбулу документа
\tikzset {terminal/.style={
                      % The shape:
                      rectangle,minimum size=6mm,rounded corners=3mm,
                      % The rest
                      very thick,draw=black!50,
                      top color=white,bottom color=black!20,
                      font=\ttfamily}}
\tikzset {nonterminal/.style={
      % The shape:
      rectangle,
      % The size:
      minimum size=6mm,
      % The border:
      very thick,
      draw=red!50!black!50,         % 50% red and 50% black,
                                    % and that mixed with 50% white
      % The filling:
      top color=white,              % a shading that is white at the top...
      bottom color=red!50!black!20, % and something else at the bottom
      % Font
      font=\itshape
    }}
Теперь будет действовать глобально на всех.
Рисуем стрелки
\usetikzlibrary {calc,positioning,shapes.misc}
\begin{tikzpicture}[node distance=5mm and 5mm,
    skip loop/.style={to path={-- ++(0,#1) -| (\tikztotarget)}}]
  \node (dot)   [terminal]                        {.};
  \node (digit) [terminal,right=of dot]           {digit};
  \node (E)     [terminal,right=of digit]         {E};

  \path (dot)   edge[->]                (digit)  % simple edges
        (digit) edge[->]                (E)
        ($ (digit.east)!.5!(E.west) $)
                edge[->,skip loop=-5mm] ($ (digit.west)!.5!(dot.east) $);
\end{tikzpicture}
Разберем кривую стрелку
($ (digit.east)!.5!(E.west) $)
                edge[->,skip loop=-5mm] ($ (digit.west)!.5!(dot.east) $);
т.е. от середины между метками (digit.east)!.5!(E.west) до середины между метками (digit.west)!.5!(dot.east) рисуем кривулину типа skip loop

Пока все довольны.
Но разобрать по частям стиль skip loop очень хочется: skip loop/.style={to path={-- ++(0,#1) -| (\tikztotarget)}}
- первая часть понятна: от текущей точке рисуем линию вертикально на заданный параметр
#1, а потом -|— рисует горизонтально, а потом вертикально к цели, это один из родственников--— рисует прямую;|-— рисует вертикально и горизонтально и..— рисует кривую- возвращаемся к поставленной цели
(\tikztotarget)вообще таких макросов три (\tikztostart, \tikztotarget, and \tikztonodes;)
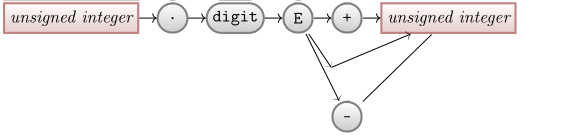
Матрицы
\usetikzlibrary {shapes.misc}
\begin{tikzpicture}
  \matrix[row sep=1mm,column sep=5mm] {
    % First row:
      & & & & \node [terminal] {+}; & \\
    % Second row:
    \node [nonterminal] {unsigned integer}; &
    \node [terminal]    {.};                &
    \node [terminal]    {digit};            &
    \node [terminal]    {E};                &
                                            &
    \node [nonterminal] {unsigned integer}; \\
    % Third row:
      & & & & \node [terminal] {-}; & \\
  };
\end{tikzpicture}
Пока \matrix представляет собой что-то вроде таблицы, со своими дополнениями.
- row sep — расстояние между строками
- column sep — расстояние между столбцами
Дальше обычная tabular.
Промежуточная задача с узлами привязки
\usetikzlibrary {shapes.misc}
\begin{tikzpicture}[point/.style={circle,inner sep=0pt,minimum size=2pt,fill=red},
                   skip loop/.style={to path={-- ++(0,#1) -| (\tikztotarget)}}]
  \matrix[row sep=1mm,column sep=2mm] {
    % First row:
    & & & & & & &  & & & & \node (plus) [terminal] {+};\\
    % Second row:
    \node (p1) [point]  {}; &    \node (ui1)   [nonterminal] {unsigned integer}; &
    \node (p2) [point]  {}; &    \node (dot)   [terminal]    {.};                &
    \node (p3) [point]  {}; &    \node (digit) [terminal]    {digit};            &
    \node (p4) [point]  {}; &    \node (p5)    [point]  {};                      &
    \node (p6) [point]  {}; &    \node (e)     [terminal]    {E};                &
    \node (p7) [point]  {}; &                                                    &
    \node (p8) [point]  {}; &    \node (ui2)   [nonterminal] {unsigned integer}; &
    \node (p9) [point]  {}; &    \node (p10)   [point]       {};\\
    % Third row:
    & & & & & & &  & & & & \node (minus)[terminal] {-};\\
  };

  \path (p4) edge [->,skip loop=-5mm] (p3)
        (p2) edge [->,skip loop=5mm]  (p6);
\end{tikzpicture}
- Описываем стиль
[point/.style={circle,inner sep=0pt,minimum size=2pt,fill=red}] - Расставляем точки в матрице и даем им имена:
\node (p1) [point] {}; - Соединяем точки
edge—(p4) edge [->,skip loop=-5mm] (p3)
Частично задача решена. Вторым этапом убираем видимость точек и результат готов.
Команда GRAPH (библиотека graphs)
Это еще одна мощная команда, которая должна со всем этим хозяйством управиться.
\begin{tikzpicture}[skip loop/.style={to path={-- ++(0,#1) -| (\tikztotarget)}},
                    point/.style={circle,inner sep=0pt,minimum size=2pt,fill=red},
                    hv path/.style={to path={-| (\tikztotarget)}},
                    vh path/.style={to path={|- (\tikztotarget)}}]
  \matrix[row sep=1mm,column sep=2mm] {
    % First row:
    & & & & & & &  & & & & \node (plus) [terminal] {+};\\
    % Second row:
    \node (p1) [point]  {}; &    \node (ui1)   [nonterminal] {unsigned integer}; &
    \node (p2) [point]  {}; &    \node (dot)   [terminal]    {.};                &
    \node (p3) [point]  {}; &    \node (digit) [terminal]    {digit};            &
    \node (p4) [point]  {}; &    \node (p5)    [point]  {};                      &
    \node (p6) [point]  {}; &    \node (e)     [terminal]    {E};                &
    \node (p7) [point]  {}; &                                                    &
    \node (p8) [point]  {}; &    \node (ui2)   [nonterminal] {unsigned integer}; &
    \node (p9) [point]  {}; &    \node (p10)   [point]       {};\\
    % Third row:
    & & & & & & &  & & & & \node (minus)[terminal] {-};\\
};

  \graph {
    (p1) -> (ui1) -- (p2) -> (dot) -- (p3) -> (digit) -- (p4)
         -- (p5)  -- (p6) -> (e) -- (p7) -- (p8) -> (ui2) -- (p9) -> (p10);
    (p4) ->[skip loop=-5mm]  (p3);
    (p2) ->[skip loop=5mm]   (p5);
    (p6) ->[skip loop=-11mm] (p9);
    (p7) ->[vh path]         (plus)  -> [hv path] (p8);
    (p7) ->[vh path]         (minus) -> [hv path] (p8);
  };
\end{tikzpicture}
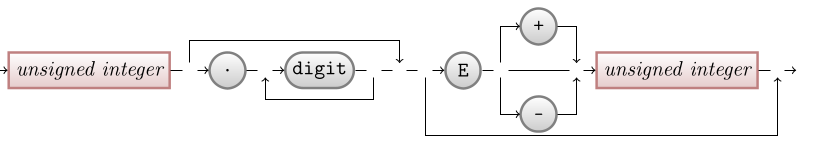
Завершаем оформление и добавляем стрелочки
Библиотека arrows.meta: и вариант работы p7 ->[vh path] { plus, minus } -> [hv path] p8; библиотеки graphs по раздвоению стрелок. Просто перечисляем узлы в фигурных скобках.
Итоговый вариант:
\begin{tikzpicture}[skip loop/.style={to path={-- ++(0,#1) -| (\tikztotarget)}},
                    point/.style={circle,inner sep=0pt,minimum size=2pt,fill=red},
                    >={Stealth[round]},thick,black!50,text=black,
                    every new ->/.style={shorten >=1pt},
                    graphs/every graph/.style={edges=rounded corners},
                    hv path/.style={to path={-| (\tikztotarget)}},
                    vh path/.style={to path={|- (\tikztotarget)}}]
  \matrix[column sep=4mm] {
    % First row:
    & & & & & & &  & & & & \node (plus) [terminal] {+};\\
    % Second row:
    \node (p1) [point]  {}; &    \node (ui1)   [nonterminal] {unsigned integer}; &
    \node (p2) [point]  {}; &    \node (dot)   [terminal]    {.};                &
    \node (p3) [point]  {}; &    \node (digit) [terminal]    {digit};            &
    \node (p4) [point]  {}; &    \node (p5)    [point]  {};                      &
    \node (p6) [point]  {}; &    \node (e)     [terminal]    {E};                &
    \node (p7) [point]  {}; &                                                    &
    \node (p8) [point]  {}; &    \node (ui2)   [nonterminal] {unsigned integer}; &
    \node (p9) [point]  {}; &    \node (p10)   [point]       {};\\
    % Third row:
    & & & & & & &  & & & & \node (minus)[terminal] {-};\\
};

  \graph [use existing nodes] {
    p1 -> ui1 -- p2 -> dot -- p3 -> digit -- p4 -- p5  -- p6 -> e -- p7 -- p8 -> ui2 -- p9 -> p10;
    p4 ->[skip loop=-5mm]  p3;
    p2 ->[skip loop=5mm]   p5;
    p6 ->[skip loop=-11mm] p9;
    p7 ->[vh path] { plus, minus } -> [hv path] p8;

};
\end{tikzpicture}
Более серьезное погужение в GRAPHs
\tikz \graph [grow right=2cm] { unsigned integer -> d -> digit -> E };
выдаст сразу: 
Добавим стилей:
\tikz \graph [grow right sep] {
  unsigned integer[nonterminal] -> "."[terminal] -> digit[terminal] -> E[terminal]
};

Добавим + и -:
\usetikzlibrary {graphs,shapes.misc}
\tikz \graph [grow right sep] {
  unsigned integer  [nonterminal] ->
  "."               [terminal] ->
  digit             [terminal] ->
  E                 [terminal] ->
  {
    "+"             [terminal],
    ""              [coordinate],
    "-"             [terminal]
  } ->
  ui2/unsigned integer [nonterminal]
};
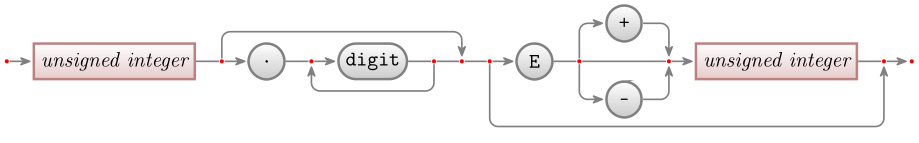
Окончательный вариант через Graphs
\usetikzlibrary {arrows.meta,graphs,shapes.misc}
\tikz [>={Stealth[round]}, black!50, text=black, thick,
       every new ->/.style = {shorten >=1pt},
       graphs/every graph/.style = {edges=rounded corners},
       skip loop/.style = {to path={-- ++(0,#1) -| (\tikztotarget)}},
       hv path/.style = {to path={-| (\tikztotarget)}},
       vh path/.style = {to path={|- (\tikztotarget)}},
       nonterminal/.style = {
         rectangle, minimum size=6mm, very thick, draw=red!50!black!50, top color=white,
         bottom color=red!50!black!20, font=\itshape, text height=1.5ex,text depth=.25ex},
       terminal/.style = {
         rounded rectangle,  minimum size=6mm, very thick, draw=black!50, top color=white,
         bottom color=black!20, font=\ttfamily, text height=1.5ex, text depth=.25ex},
       shape = coordinate
       ]
  \graph [grow right sep, branch down=7mm, simple] {
    / -> unsigned integer[nonterminal] -- p1 -> "." [terminal] -- p2 -> digit[terminal] --
    p3 -- p4 -- p5 -> E[terminal] -- q1 ->[vh path]
    {[nodes={yshift=7mm}]
      "+"[terminal], q2, "-"[terminal]
    } -> [hv path]
    q3 -- /unsigned integer [nonterminal] -- p6 -> /;

    p1 ->[skip loop=5mm]   p4;
    p3 ->[skip loop=-5mm]  p2;
    p5 ->[skip loop=-11mm] p6;

    q1 -- q2 -- q3;  % make these edges plain
  };
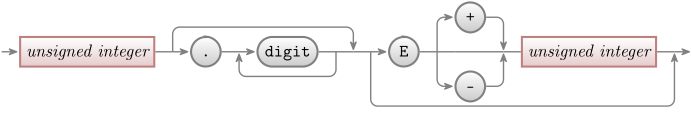
Особенности кода:
- использовании групп, при делении веток, группы заключаем в
{} - анонимные координаты обозначаются
/ simpe— свойство graph — которое определяем, что между 2-мя узлами может быть только 1edge.graphs/every graph/.style = {edges=rounded corners}— закругленные уголки у стрелок>={Stealth[round]}, black!50, text=black, thick,— стиль стрелок