Примеры по Эвклиду
Categories:
Установка необходимых библиотек для работы
\documentclass{article} % say
% For LaTeX:
\usepackage{tikz}
\usetikzlibrary{calc,intersections,through,backgrounds}
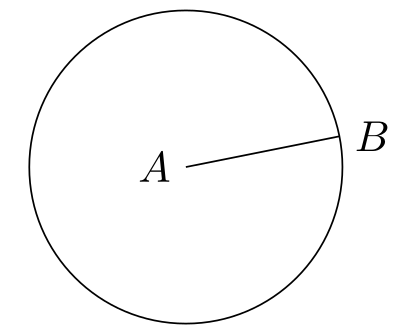
\begin{tikzpicture}
\coordinate [label=left:\textcolor{blue}{$A$}] (A) at (0,0);
\coordinate [label=right:\textcolor{blue}{$B$}] (B) at (1.25,0.25);
\draw[blue] (A) -- (B);
\end{tikzpicture}
Мощь библиотеки calc
\begin{tikzpicture}
  \coordinate [label=left:\textcolor{blue}{$A$}] (A) at ($ (0,0) + .1*(rand,rand) $);
  \coordinate [label=right:\textcolor{red}{$B$}] (B) at ($ (1.25,0.25) + .1*(rand,rand) $);

  \draw[blue] (A) -- (B);
\end{tikzpicture}
Все вычисления происходят между двух символов $.
Особенность оператора rand, что он каждый раз будет вычисляться одинаково. Т.е. не такой он уж и случайное число.
Оператор let и команда veclen
\usetikzlibrary {calc}
\begin{tikzpicture}
  \coordinate [label=left:$A$]  (A) at (0,0);
  \coordinate [label=right:$B$] (B) at (1.25,0.25);
  \draw (A) -- (B);

  \draw (A) let
              \p1 = ($ (B) - (A) $)
            in
              circle ({veclen(\x1,\y1)});
\end{tikzpicture}
\p1 = ($ (B) - (A) $)вычислит длину вектора и запишет в переменную1p— это команда записать точку (коорд.x, коорд.y)veclen(\x1,\y1)— соответственно передать коордитатыxиyиз переменной1и вычислить их длину для радиуса.n— похожа наp, но записывает число.
т.е. let определил p1 и передал in в circle
\usetikzlibrary {calc}
\begin{tikzpicture}
 \coordinate [label=left:$A$]  (A) at (0,0);
 \coordinate [label=right:$B$] (B) at (1.25,0.25);
 \draw (A) -- (B);

 \draw let \p1 = ($ (B) - (A) $),
           \n2 = {veclen(\x1,\y1)}
       in
         (A) circle (\n2)
         (B) circle (\n2);
\end{tikzpicture}
в этом примере, как раз вычисленный радиус, записали в переменную 2. Вместо цифры в этих переменных можно использовать длинные имена в скобках n{ragius} и также их использовать circle (\n{radius})
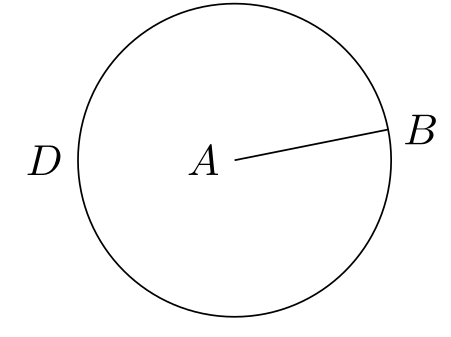
Библиотека THROUGH
Создадим окружность через точку B относительно A, находящейся в центре координат. Т.е. точку A он всегда будет считать центром.
\usetikzlibrary {through}
\begin{tikzpicture}
  \coordinate [label=left:$A$]  (A) at (0,0);
  \coordinate [label=right:$B$] (B) at (1.25,0.25);
  \draw (A) -- (B);

  \node [draw,circle through=(B),label=left:$D$] at (A) {};
\end{tikzpicture}
Библиотека INTERSECTION
\usetikzlibrary {intersections,through}
\begin{tikzpicture}
  \coordinate [label=left:$A$]  (A) at (0,0);
  \coordinate [label=right:$B$] (B) at (1.25,0.25);
  \draw (A) -- (B);

  \node (D) [name path=D,draw,circle through=(B),label=left:$D$]  at (A) {}; %нода D и путь D это разные объекты, можно называть по разному
  \node (E) [name path=E,draw,circle through=(A),label=right:$E$] at (B) {};

  % Name the coordinates, but do not draw anything:
  \path [name intersections={of=D and E}];

  \coordinate [label=above:$C$] (C) at (intersection-1);

  \draw [red] (A) -- (C);
  \draw [red] (B) -- (C);
\end{tikzpicture}
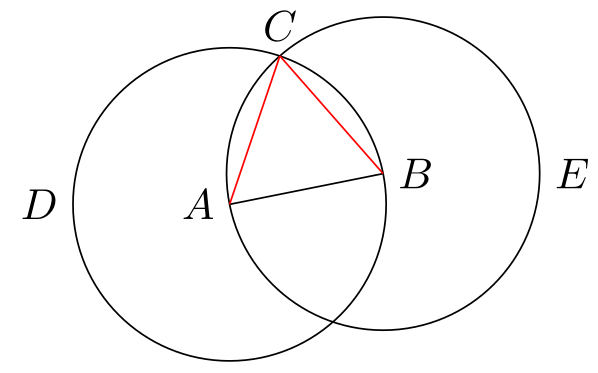
\node (D) [name path=D,draw,circle through=(B),label=left:$D$]задаем имя\pathгде проходит окружность.\path [name intersections={of=D and E}];— определяем пересечение двух путей D и E и у них образуются точки пересечения как(intersection-1)и(intersection-2).\coordinate [label=above:$C$] (C) at (intersection-1);— определим точку C с координатами пересечения.
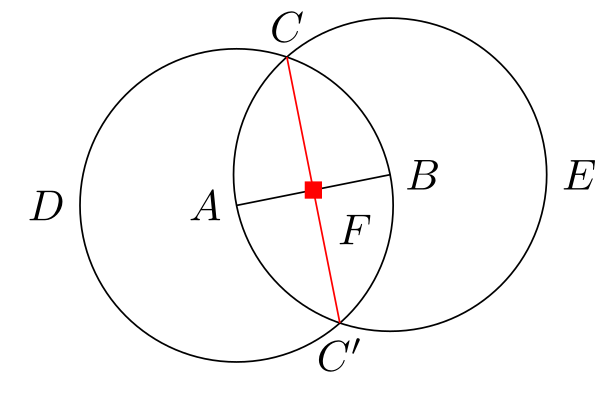
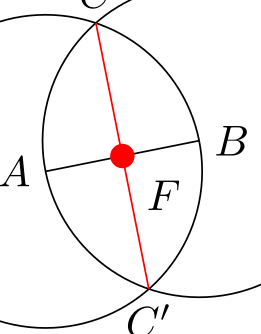
но есть еще у name intersections команда by, которая все это решит автоматически: \path [name intersections={of=D and E, by={[label=above:$C$]C, [label=below:$C'$]C'}}]; т.е. поставит точки и метки в них.
Потом просто проведем линию и дадим ей тоже имя \path — \draw [name path=C--C',red] (C) -- (C'); имя будет C--C'.
Новый intersection получит точку F
\path [name intersections={of=A--B and C--C',by=F}];
\begin{tikzpicture}
 \coordinate [label=left:$A$]  (A) at (0,0);
 \coordinate [label=right:$B$] (B) at (1.25,0.25);
 \draw [name path=A--B] (A) -- (B);

 \node (D) [name path=D,draw,circle through=(B),label=left:$D$]  at (A) {};
 \node (E) [name path=E,draw,circle through=(A),label=right:$E$] at (B) {};

 \path [name intersections={of=D and E, by={[label=above:$C$]C, [label=below:$C'$]C'}}];

 \draw [name path=C--C',red] (C) -- (C');

 \path [name intersections={of=A--B and C--C',by=F}];
 \node [fill=red,inner sep=2pt,label=-45:$F$] at (F) {};
\end{tikzpicture}
это полная картина, где из нового inner sep=2pt — это толщина точки пересечения, а на самом деле просто размер node в виде точки
если бы я написал \node [fill=red,circle, inner sep=2pt,label=-45:$F$] at (F) {}; то получилось бы:
Разукрашки и определение макросов
\begin{tikzpicture}[
  thick,% толстые линии
  help lines/.style={thin,draw=black!50}]%вспомогательные линии
  \def\A{\textcolor{input}{$A$}} % макросы ABCDE со стилями меток
  \def\B{\textcolor{input}{$B$}}
  \def\C{\textcolor{output}{$C$}}
  \def\D{$D$}
  \def\E{$E$}

  \colorlet{input}{blue!80!black} % input и output цвета, которые подставятся в макросы
  \colorlet{output}{red!70!black}
  \colorlet{triangle}{orange}
Наарисуем треугольник
\draw [output] (A) -- (C) -- (B);
Поставим в вершинах точки
\foreach \point in {A,B,C}
    \fill [black,opacity=.5] (\point) circle (2pt);
Закрасим треугольник
  \begin{pgfonlayer}{background}
    \fill[triangle!80] (A) -- (C) -- (B) -- cycle;
  \end{pgfonlayer}
Итоговый код
\usetikzlibrary {backgrounds,calc,intersections,through}
\begin{tikzpicture}[thick,help lines/.style={thin,draw=black!50}]
\def\A{\textcolor{input}{$A$}} \def\B{\textcolor{input}{$B$}}
\def\C{\textcolor{output}{$C$}} \def\D{$D$}
\def\E{$E$}
\colorlet{input}{blue!80!black} \colorlet{output}{red!70!black}
\colorlet{triangle}{orange}
\coordinate [label=left:\A] (A) at ($ (0,0) + .1*(rand,rand) $);
\coordinate [label=right:\B] (B) at ($ (1.25,0.25) + .1*(rand,rand) $);
\draw [input] (A) -- (B);
\node [name path=D,help lines,draw,label=left:\D] (D) at (A) [circle through=(B)] {};
\node [name path=E,help lines,draw,label=right:\E] (E) at (B) [circle through=(A)] {};
\path [name intersections={of=D and E,by={[label=above:\C]C}}];
\draw [output] (A) -- (C) -- (B);
\foreach \point in {A,B,C}
\fill [black,opacity=.5] (\point) circle (2pt);
\begin{pgfonlayer}{background}
\fill[triangle!80] (A) -- (C) -- (B) -- cycle;
\end{pgfonlayer}
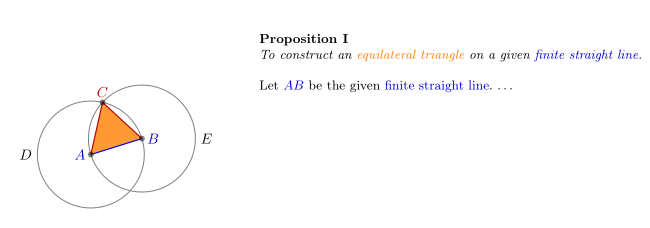
\node [below right, text width=10cm,align=justify] at (4,3) {
\small\textbf{Proposition I}\par
\emph{To construct an \textcolor{triangle}{equilateral triangle}
on a given \textcolor{input}{finite straight line}.}
\par\vskip1em
Let \A\B\ be the given \textcolor{input}{finite straight line}. \dots
};
\end{tikzpicture}
Мой первый прямоугольник с почти умными координатами
\begin{tikzpicture}
  \coordinate (NW) at (0,5); \coordinate (nw) at ($ (NW) + (1,-1) $);
  \coordinate (NE) at (7,5); \coordinate (ne) at ($ (NE) + (-1,-1) $);
  \coordinate (SE) at (7,0); \coordinate (se) at ($ (SE) + (-1,1) $);
  \coordinate (SW) at (0,0); \coordinate (sw) at ($ (SW) + (1,1) $);
\draw[black!10] (NW) -- (NE) -- (SE) -- (SW) -- cycle;
\draw[black!30, thick, fill=black!25] ($ (NW) + (1,-1) $) -- (ne) -- (se) -- (sw) -- cycle;
\fill[black!25] (nw) -- (ne) -- (se) -- (sw) -- cycle;
\end{tikzpicture}

Немного неказист, но многообещающь.
Дальше он будет понемногу обрастать,пока не превратится в то,что я задумал.
Продолжение сериала по Эвклиду.
Найдем точку между координатами
Это будет ровно посередине между A и B.
\usetikzlibrary {calc}
\begin{tikzpicture}
  \coordinate [label=left:$A$]  (A) at (0,0);
  \coordinate [label=right:$B$] (B) at (1.25,0.25);
  \draw (A) -- (B);
  \node [fill=red,inner sep=1pt,label=below:$X$] (X) at ($ (A)!.5!(B) $) {};
\end{tikzpicture}
Это для убедительности: 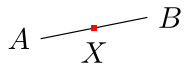
Или за пределами точек и даже сложные вычисления:
\coordinate [label=above:$D$] (D) at ($ (A) ! .5 ! (B) ! {sin(60)*2} ! 90:(B) $) {};
И еще пример, чисто как памятка, потому-что очень сложные вычисления, мне точно не нужны.
\draw (D) -- ($ (D) ! 2.5 ! (A) $) coordinate [label=below:$E$] (E); — начертит прямую и установит новую точку E